Supercomputing Power
December 22, 2013I created the following bar charts to illustrate the amount of supercomputing power held by countries on the TOP500 list. The data on supercomputing power was taken from the TOP500 November 2013 ranking of supercomputers according to the LINPACK benchmark. The chart on the right uses a log scale to depict the same data as the chart on the left. I included this log scale chart to help visualize differences between the bars appearing only as thin lines on the left.
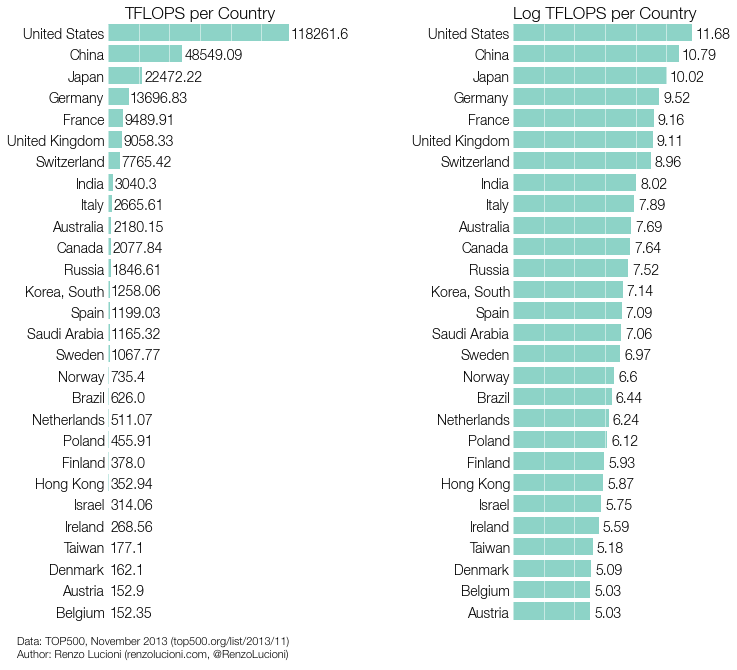
The United States, China, and Japan top the list, with Germany, France, the United Kingdom and Switzerland trailing them. India’s total is surprisingly low.
I was also curious about the amount of supercomputing power available per capita in each of these countries. The data on country populations, used to calculate the per capita totals, was taken from Wikipedia’s list of countries by population. As before, the chart on the right uses a log scale to depict the same data as the chart on the left.
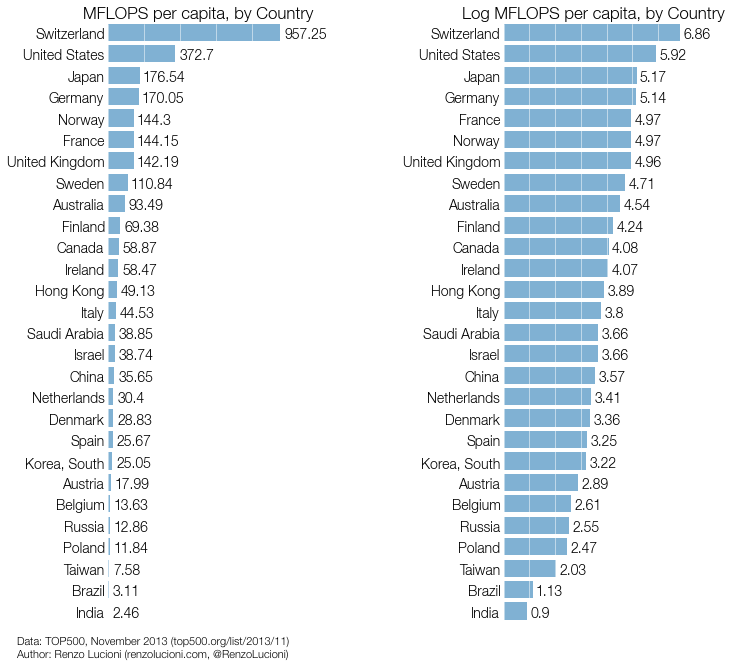
Switzerland’s high per capita totals may be attributable to the country’s small population and the number of academic research institutions located there. The United States remains in second place, while China has dropped to 17th place. As expected, India ranks last among these countries in terms of per capita supercomputing power.
I made these charts using an IPython notebook.